


Posted By
“Measurement is fabulous. Unless you're busy measuring what's easy to measure as opposed to what's important” –Seth Godin.
So, what are these really important things to measure? Being a software enthusiast, I think a system’s or application’s performance is one thing that you cannot ignore. In general, we tend to measure at three levels: network, machine, and application level. Application metrics are mostly the hardest and the most important of the three. Application metrics are very specific to your business, and they change as your applications change.
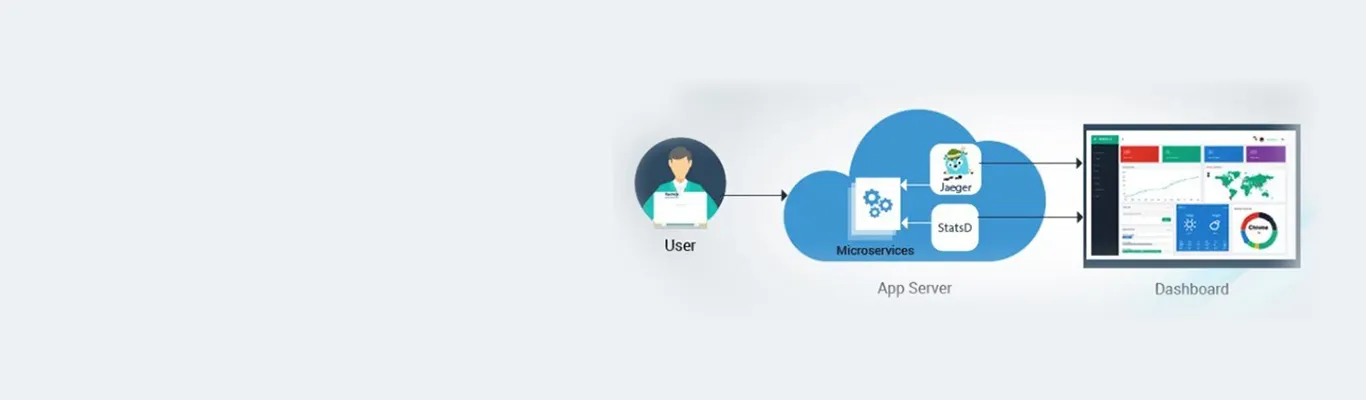
In this blog, I will be targeting the User Datagram Protocol (UDP) based containerized metric collector and tracing systems - StatsD and Jaeger with sample application integration.
Using the UDP protocol has some perks while tracing the application; the UDP protocol will not slow down the application. The UDP works on the “fire and forget principle.” Your application tracing systems may or may not get the data, and irrespective of it, the application will stay up and running. Even if the stats are awry, it won’t affect the system or application’s performance.
StatsD
StatsD is a front-end proxy for the Graphite/Carbon metrics server. The first implementation was developed with node.
You can install it from PyPI:
$ pip install statsd
A typical StatsD integration with an application looks like this:
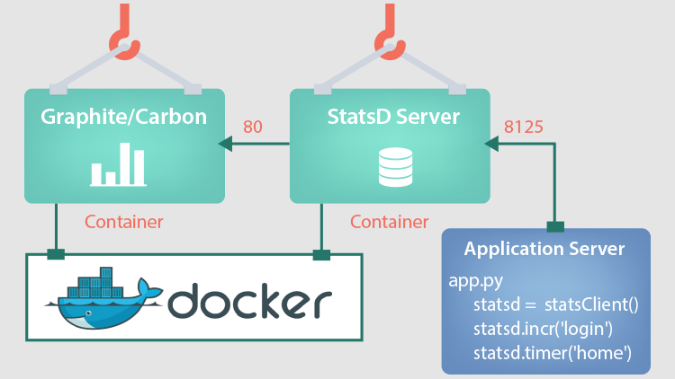
Fig - StatsD integration with the application.
The configuration includes the following components:
- StatsD Client - This is used to collect the metrics from the application. The client library is injected into the application and statsd injected code starts collecting the metrics and sends it to the server for processing.
- StatsD Server - StatsD client sends the data to the StatsD server. StatsD Server parses the messages, extracts metrics data, and periodically flushes the data to graphite.
- Graphite - This is used for visualization purposes along with Carbon, which is a high-performance service that listens to time-series data. StatsD Server sends the parsed data to Graphite. The graphite visualizes the metrics in different graphs.
Graphite is very easy to use and has very powerful graphing and data manipulation capabilities. Most importantly, for StatsD, you can create new metrics in graphite just by sending data for that metric. That means there’s no management overhead for engineers to start tracking something new. You can simply tell StatsD that you want to track “grue.dinners” and it’ll automatically appear in graphite. (By the way, because we flush data to graphite every 10 seconds, our StatsD metrics are nearly real-time.)
Here’s how we can do it using our Python StatsD library:
1. Track the counters:
//import

from statsd import StatsClient
// create statsd object
statsd = StatsClient(host=os.getenv('STATSD_SERVER', 'localhost'), port= os.getenv('STATSD_SERVER_PORT', 8125), prefix=None, maxudpsize=512)
// send metric
statsd.incr('homepage')
The above line of code will create a new counter on the fly and increment it every time it’s executed.
You can then go have a look at your graph and check how many times the page has been requested.
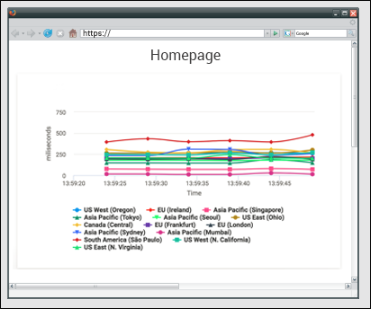
Fig - sample graph generated in graphite.
Graphite visualizes the data received from statsD server in a meaningful way in the form of different graphs. Above is the graph for a webpage that shows how much time (in milliseconds) a particular page is accessed by users from different geographies during a given time.
2. Track execution times:
// create  timer
foo_timer = statsd.timer('ShowSignUpTime')

// start the timer
foo_timer.start()

// call showSignUp page
ShowSignUp()

// stop the timer
foo_timer.stop()
The above code snippet will help you calculate the execution time as a part of the showSignUp() page.
We’re measuring the execution times as a part of our search infrastructure.
You can download the Python source code from this repo here:
https://github.com/opcito-technologies/PythonFlaskStatsDMySQLApp
Using StatsD to monitor the Java-based application, including JVM profiler and MySQL.
If you are wondering - how to integrate your application with StatsD, here is a link that will help you understand StatsD integration with Java application:
https://github.com/opcito-technologies/JavaAppStatsDMySQLJvmProfiler
Jaeger
Jaeger makes it easy to monitor complex, microservice-based architectures by using consistent upfront sampling with individual per service/endpoint probabilities. It is capable of monitoring distributed context propagation, distributed transaction monitoring, root cause analysis, service dependency analysis, and performance and latency optimization.
Microservices ecosystem brings its own challenges such as loss of visibility into the system and the complex interactions between services. Traditional monitoring tools such as metrics and distributed logging still have their place, but they often fail to provide visibility across services. This is where distributed tracing comes in.
OpenTracing is a new, open standard for instrumenting applications and OSS packages for distributed tracing and monitoring. If you are looking to monitor a microservices-based architecture and perform root cause analysis of performance issues OpenTracing is just the thing for you. Here is a link to setup Jaeger (on Docker container) with the HotRod Go application:
https://github.com/opcito-technologies/JaegerHotRodGOApplication
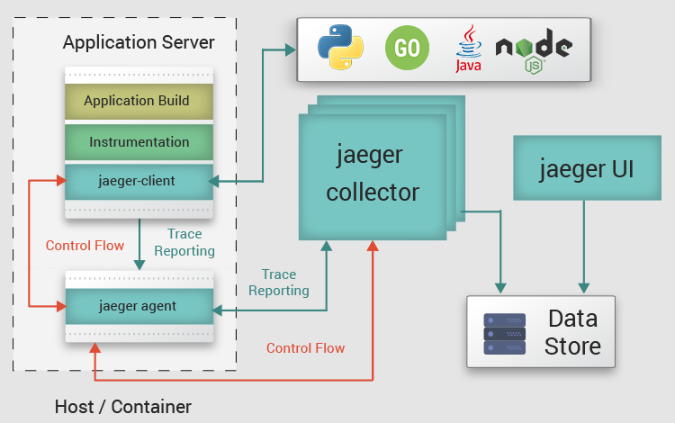
Fig - Jaeger Integration with the application.
This diagram exhibits the architecture of how you can integrate Jaeger with your application and shows the mechanism of Jaeger to collect events from the application server. The setup includes the following components:
- Jaeger Client - Jaeger clients are language-specific implementations of the OpenTracing API.
- Jaeger Agent - A network daemon that listens to spans sent over UDP, which it batches and sends to the collector. It is designed to be deployed to all hosts as an infrastructure component. The agent abstracts the routing and discovery of the collectors away from the client.
- Jaeger Collector - The collector receives traces from Jaeger agents and runs them through a processing pipeline.
- Jaeger UI - Web UI for Jaeger.
Keeping track of everything is a very important aspect, in my opinion. And when it comes to tracking the performance of your application, which is an important aspect of any system, these two tools will certainly help you track what you need to track, and that too without any hassle. It is very easy to instrument your applications with these two because of the rapport with almost any ecosystem. So, if you are looking for an end-to-end distributed system to trace and monitor your complex architectures, you know where and what to look for.


Related Blogs