


Posted By
Monitoring Kubernetes clusters is different from monitoring client-server networks because of the master-node architecture. Some of the parameters that need consistent monitoring include pod resources, memory usage, CPU utilization, network bandwidth, disk pressure, etc. Kubernetes, by itself, does not self-monitor. However, it can be fine-tuned to detect problems in their early stages. Ideally, these clusters should take corrective action as soon as the parameters mentioned above slightly exceed their threshold. If this is not the case, it must at least ensure that alerts are generated so that issues arising in the clusters can be taken care of manually.
Here, we will take a look at how Prometheus and Grafana can be used for cluster monitoring. While Prometheus comes geared with exceptional querying, analytical, and alerting capabilities, Grafana is used to simply visualize the retracted information and draw meaningful insights from it. But first, let’s discuss the importance of monitoring for K8s.
Why monitoring is so important?
Clusters are used to maintain high reliability and efficient throughput. For effective working, clusters are established on various nodes so that they can communicate among themselves. There can be clusters on various nodes or a combination of clusters. This boosts the overall performance and appropriate use of system resources. With the growing need for clusters, regular monitoring is rapidly becoming an essential aspect of reliable and superior performance.
Cluster monitoring involves assessing the performance of cluster entities either as individual nodes or as a collection of nodes. It must ensure that the cluster is functionally stable and working efficiently. Cluster Monitoring systems should provide some basic information about the clusters, like the communication & interoperability between various nodes of the cluster. Since cluster nodes are set up over different servers, broad coverage, and consistent view pose a big challenge. Real-time visualization of cluster data (of individual nodes or collective) improves the overall performance of applications.
Prometheus
Originally built by SoundCloud, Prometheus is one of the popular open-source systems monitoring & alerting toolkit. Prometheus primarily supports a pull-based HTTP model; however, it also supports alerts. Prometheus records a purely numeric time series efficiently irrespective of the type of monitoring, which could be machine-centric or of highly dynamic service-oriented architectures. While the Prometheus server is the main component that scrapes and stores time series data, Alertmanager handles alerts.
Some of the interesting features of Prometheus are as follows:
- Multidimensional data model with time series data identified by the metric name
- PromQL flexible query language
- Single server nodes, no distributed storage
- Time series collection happens via a pull model over HTTP
- Pushing time series is supported via an intermediary gateway
- Targets are discovered via static configuration or service discovery.
Grafana
Grafana is an open-source visualization tool. It can be used on a variety of data stores, but it is commonly used with Graphite, InfluxDB, and Prometheus. Grafana allows queries and metrics visualization.
We have to automate Grafana using the Ansible playbook. To get the data from the Prometheus server, we must configure the Prometheus data source in Grafana. We can create our own dashboards to visualize this data but we have imported the dashboards that are available on the Grafana website. We have also automated dashboard import using Ansible. Here is an example of a sample Grafana dashboard -

How to monitor a Kubernetes service with Prometheus?
Prometheus metrics are exposed by services through HTTP(S), and there are several advantages of this approach when compared with other similar monitoring solutions, which are as follows:
- You don’t need to install a service agent; just expose a web port. Prometheus servers will regularly scrape (pull), so you don’t need to worry about pushing metrics or configuring a remote endpoint either.
- Several microservices already use HTTP for their regular functionality. You can reuse an internal web server and just add a folder with the name, /metrics.
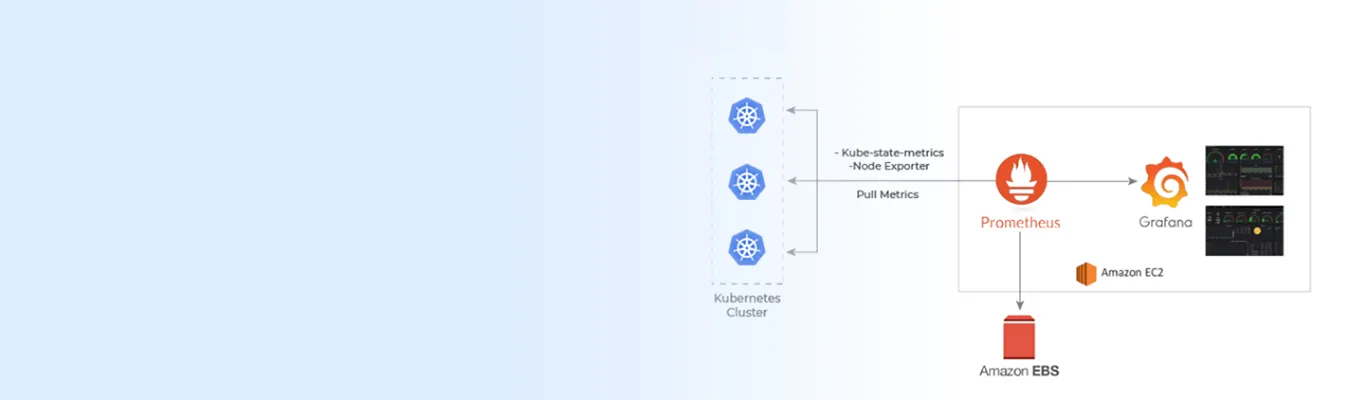
To get the Kubernetes metrics, we have used Kube-state-metrics and node-exporter. Kube-state-metrics is a simple service that listens to the Kubernetes API servers and generates metrics about the state of objects, such as deployments, nodes, and pods. It is important to note that Kube-state-metrics is just a metrics endpoint; another entity needs to scrape it and provide long-term storage (i.e., the Prometheus server).
Node-exporter is a Prometheus exporter for hardware and OS metrics. It will be automatically deployed when we use the Prometheus operator. It allows for measuring various machine resources such as memory, disk, and CPU utilization. It can be deployed as a DaemonSet and thus will automatically scale if you add or remove nodes from your cluster.
Scrape configs
It defines a set of targets and parameters. One scrape config specifies a single job. We have added 3 jobs in our Prometheus server to scrape configs.
prometheus_scrape_configs:

  - job_name: 'node'

    ec2_sd_configs:

      - region: eu-west-1

        access_key: ""

        secret_key: ""

        port: 9100

    relabel_configs:

      - source_labels: [__meta_ec2_tag_Name]

        regex: test_worker_nodes

        action: keep

  - job_name: 'metrics'

    ec2_sd_configs:

      - region: eu-west-1

        access_key: ""

        secret_key: ""

        port: 30080

    relabel_configs:

      - source_labels: [__meta_ec2_tag_Name]

        regex: test_workers_nodes

        action: keep
	- job_name: 'kubelet'

    ec2_sd_configs:

  	  - region: eu-west-1

   		access_key: ""

        secret_key: ""

        port: 9100

        relabel_configs:

        - source_labels: [__meta_ec2_tag_Name]

        regex: test_worker_nodes

        action: keep
In ec2_sd_configs, we need to specify a region, access_key, secret_key, and port from where we need to scrape configs. Add relabel_configs to only monitor instances with a name starting with "test_worker_nodes".cluster.
Why we have separated the monitoring cluster?
We have set up Prometheus and Grafana on a cluster that is different from the Kubernetes. The main reason for this is if the Kubernetes cluster goes down, we will have the monitoring data available from Prometheus and Grafana on a separate cluster. This will enable us to check what is creating the issue and eventually fix it.
Generally, we are running kube_state_metrics and node_exporter on Kubernetes nodes that generate statistics. Prometheus gets the data through scrape_config that needs to be configured on the Prometheus side.
That was a little about how you can monitor your pods and clusters using Prometheus and Grafana. Alongside these, we also discussed the importance of monitoring, the use of Kube-state-metrics & Node Exporter, the use of scrape configs to define parameters and targets, and why to set up Prometheus and Grafana on a different cluster. There are several other tools that you can use to monitor Kubernetes clusters, including Heapster, InfluxDB, CA Advisor, etc., based on your preferences. Well, that’s it for now; happy monitoring!


Related Blogs