
 Security Product Engineering












Know What Your AI Is Actually Doing in Production
We instrument the layer that determines whether your AI works: output quality, retrieval accuracy, cost, and every agent and tool call, not just whether the service is up.
Trusted by leading ISVs
and ecosystem partners



















Your AI Can Be Wrong at Scale While Every Metric Stays Green
Hallucinations, retrieval failures, output drift, and token cost spirals are invisible to infrastructure monitoring. We instrument the layer that actually determines whether your AI is working: output quality, retrieval faithfulness, prompt and user-level cost attribution, and agent execution traces across every tool, sub-agent, and skill call and handoff.
The Signals That Show Whether Your AI Works
We instrument output quality, retrieval accuracy, cost, and every agent and tool call, the signals that actually determine whether your AI is working.
End-to-end tracing across every step of an LLM request, from retrieval through model call to post-processing, captured at the application, session, and span level. When a request fails, the trace shows exactly which stage caused it, not a black box.
Tracking retrieval recall, precision, and latency alongside vector store query volume and index performance. Retrieval failures account for most RAG underperformance in production, and tracing that only captures the model call misses this layer entirely.
Tracing the full execution graph across agent handoffs, tool, sub-agent, and skill calls, and retry loops, using OpenTelemetry-based instrumentation and open-source SDKs, not proprietary lock-in. A failed workflow shows exactly which step it started at.
Scoring production outputs for faithfulness, relevance, and hallucination rate continuously, not just at launch. Output quality drifts when prompts change, model providers update checkpoints, or real user queries shift away from what the evaluation set covered.
Continuous sampling of production outputs against retrieved context, with faithfulness scores below defined thresholds triggering alerts before quality degradation reaches a level users notice and report.
Automatically redacting PII and other sensitive data from logs and traces before they're stored, so personal data never sits in a debug log by accident, supporting GDPR, HIPAA, and SOC 2 requirements around data handling.
Per-request token consumption and cost tracking attributed by team, application, environment, or agent, with anomaly alerts when usage patterns shift and alerts when spend approaches defined thresholds.
Alerting when a model provider pushes a checkpoint update that changes output behavior or quality, so a silent upstream change doesn't become a downstream regression the team only discovers from user complaints.
Tamper-evident, append-only logging of every model decision and tool action, structured to satisfy compliance requirements under the EU AI Act Article 12, which mandates automatic event logging for high-risk AI systems, and SOC 2 audit expectations.
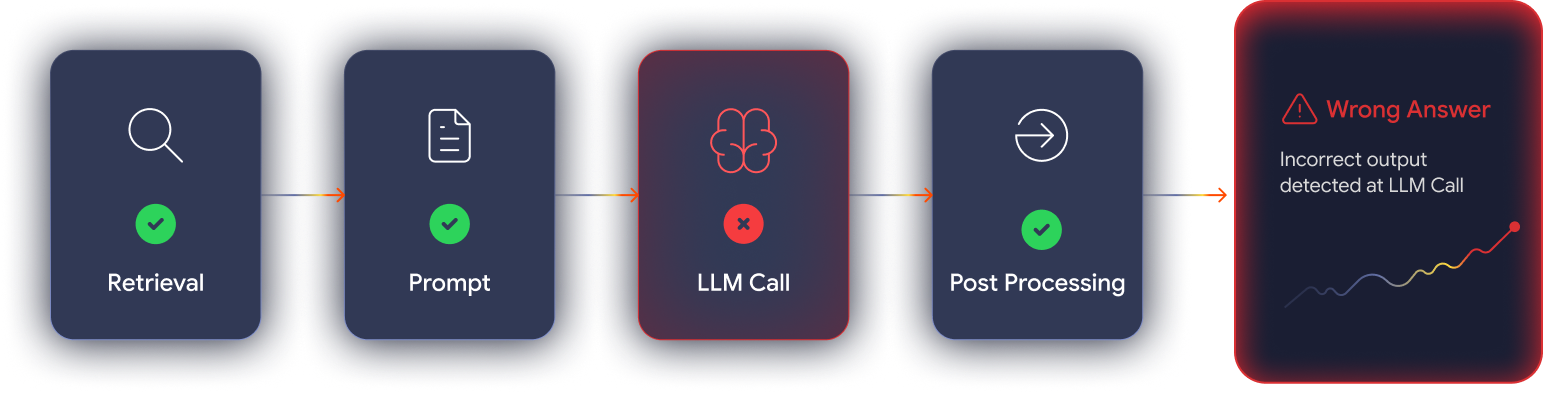

Pinpoint Failures
Know which stage
caused a failed request

Full Request Path
Retrieval, model call,
and post-processing traced

Session-Level View
Application, session,
and span-level detail
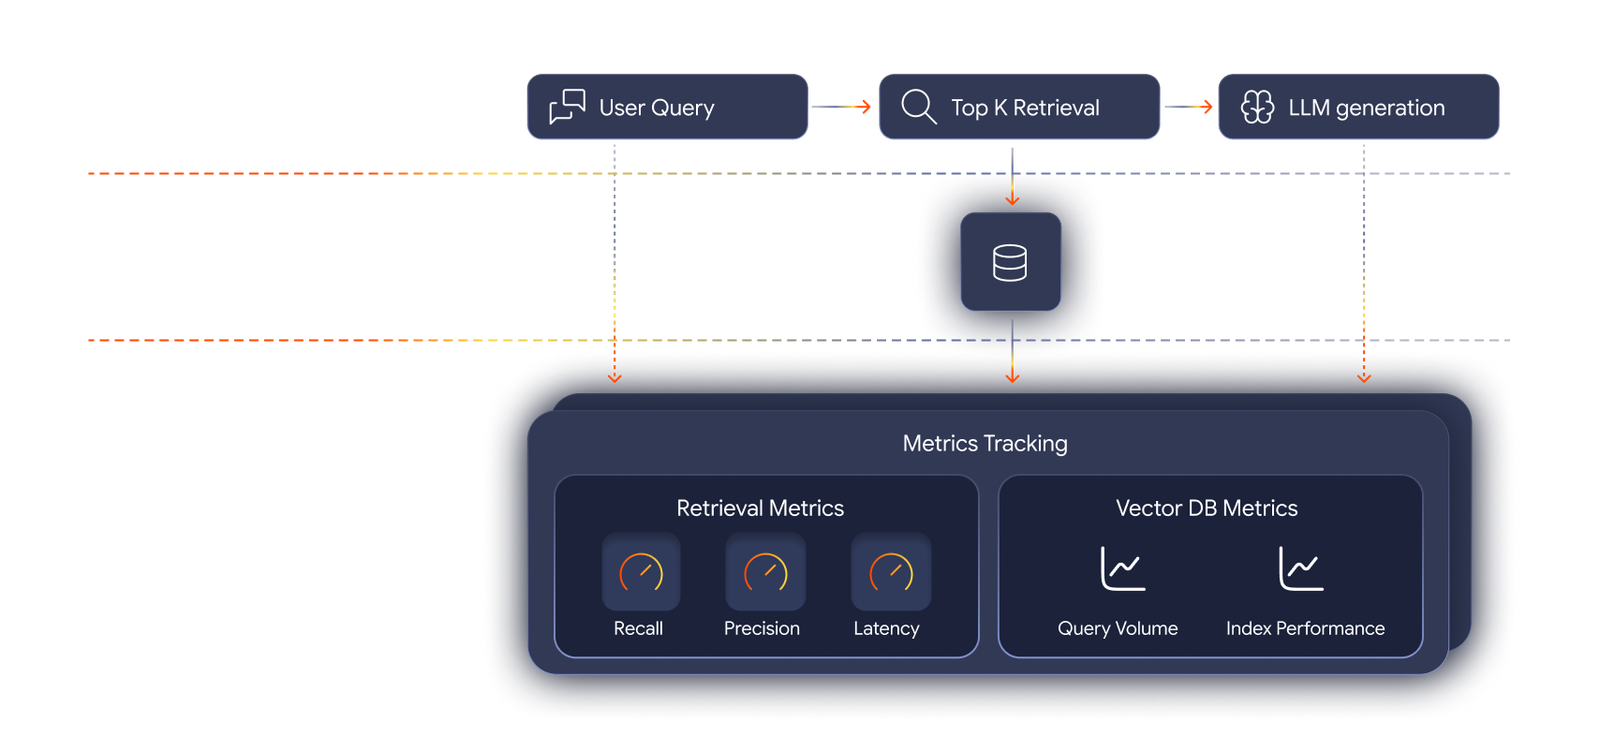
Retrieval Accuracy
Recall, precision,
and latency tracked
Vector Health
Query volume and
index performance monitored
Root Cause Clarity
Most RAG failures start
here, not at the model
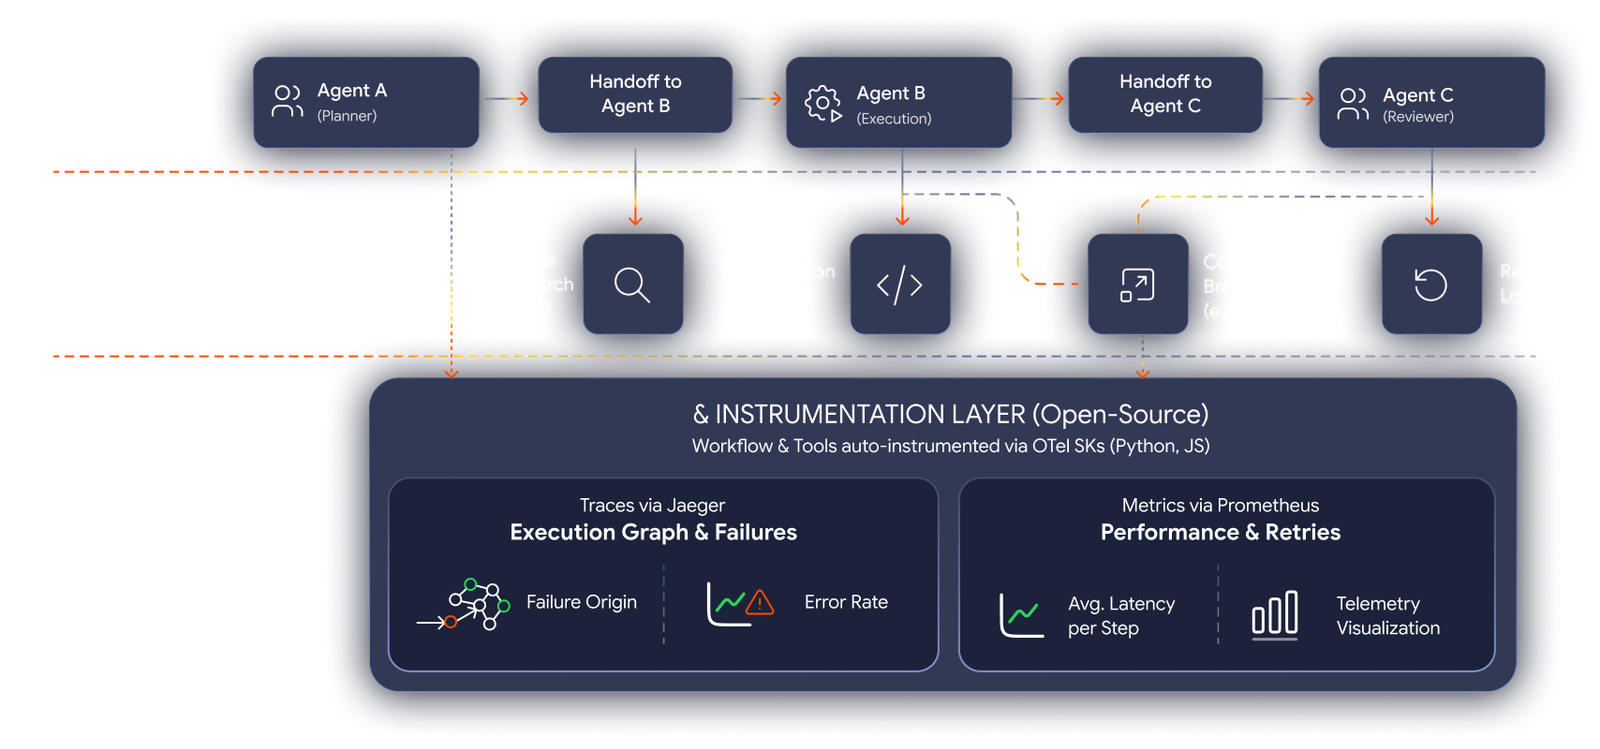
Execution Graph
Agent handoffs, tool
calls, and retries traced
Step-Level Blame
See which step a failed
workflow started at
No Vendor Lock-In
See which step a failed
workflow started at
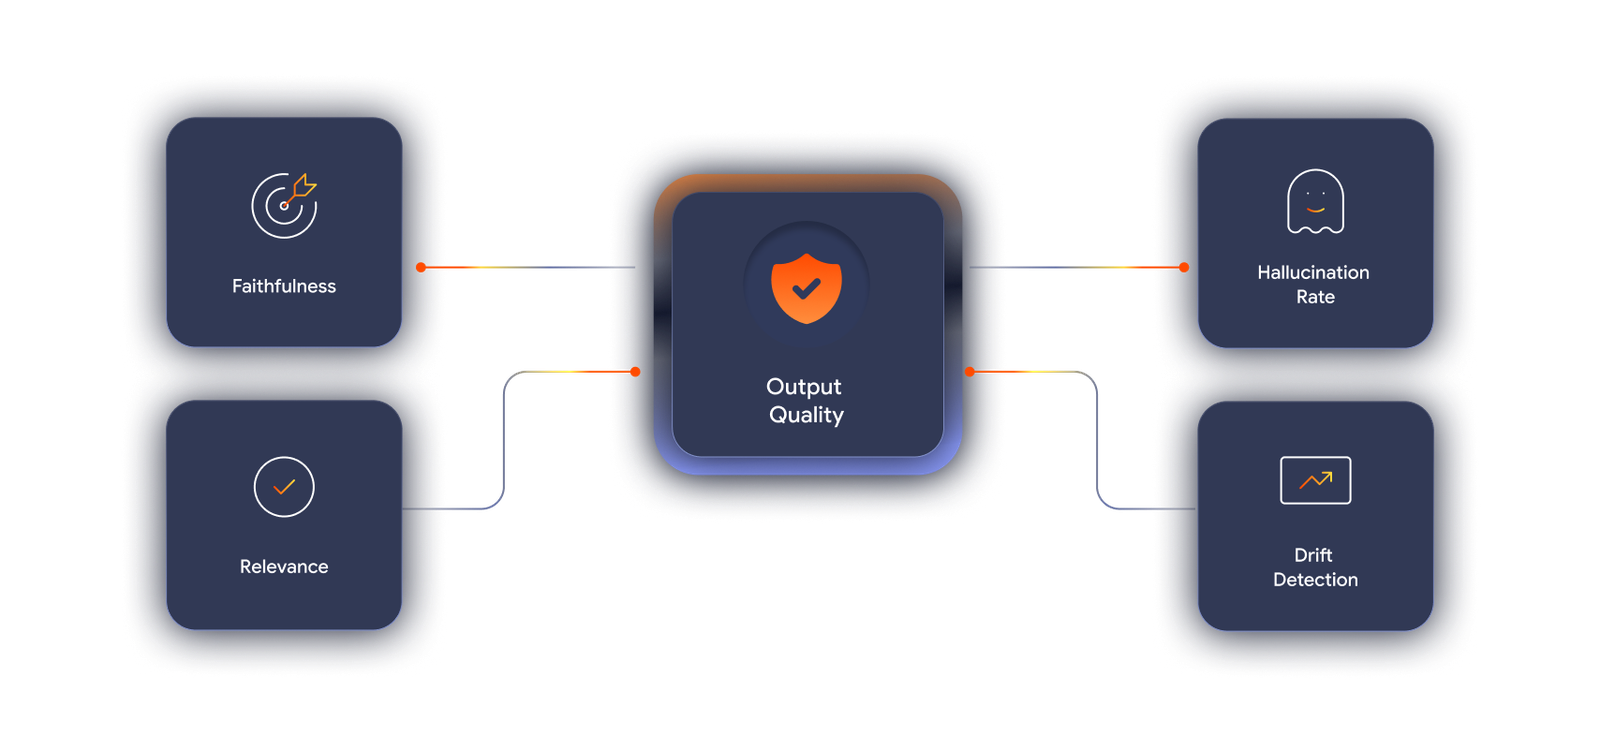
Continuous Scoring
Faithfulness and relevance
scored continuously
Drift Detection
Catches drift from
prompt or model changes
Quality Over Time
Quality tracked long
after launch day
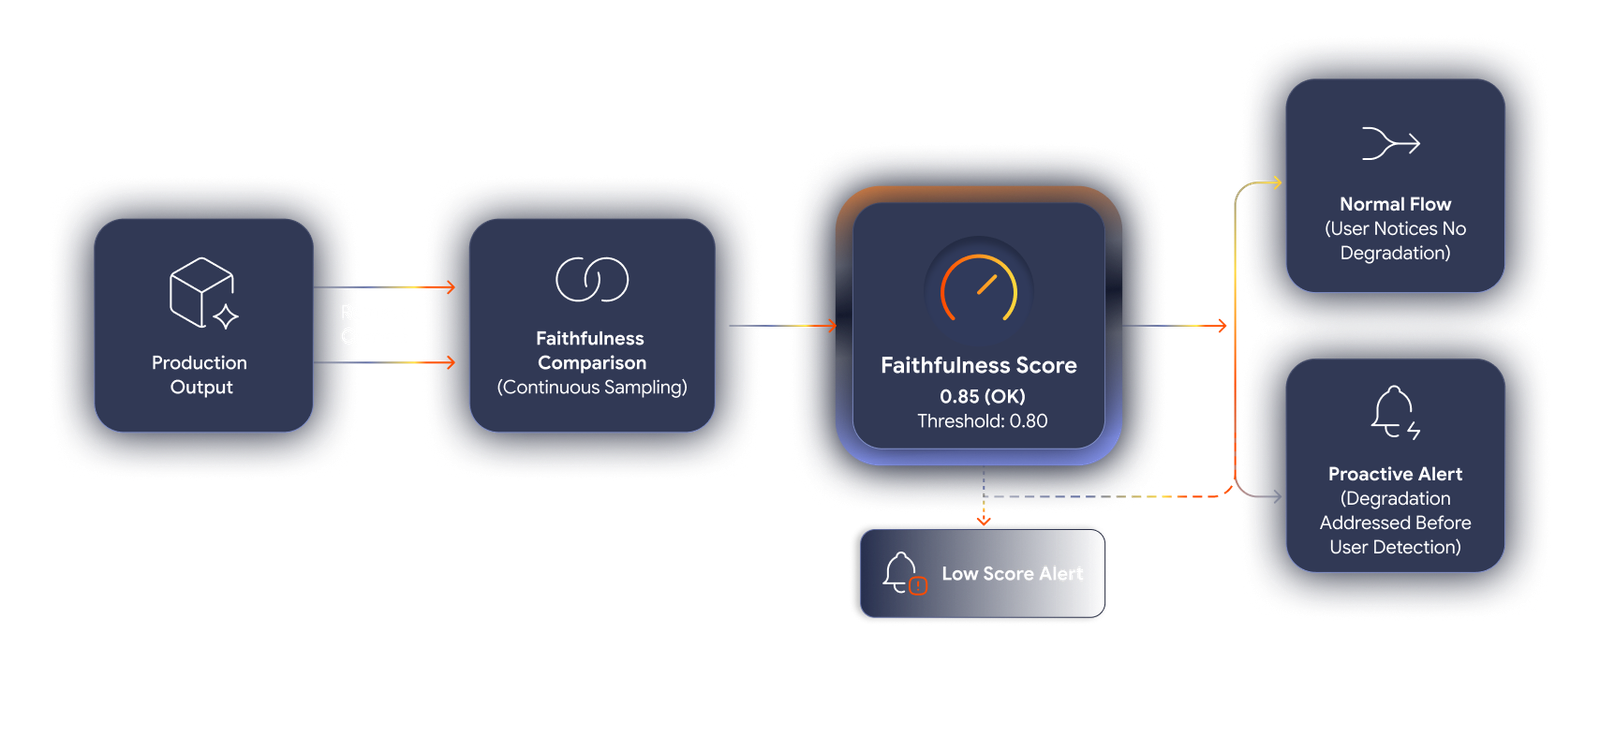
Grounded Outputs
Outputs sampled
against retrieved context
Threshold Alerts
Alerts fire below defined
faithfulness scores
Catch It Early
Caught before users
notice and report it
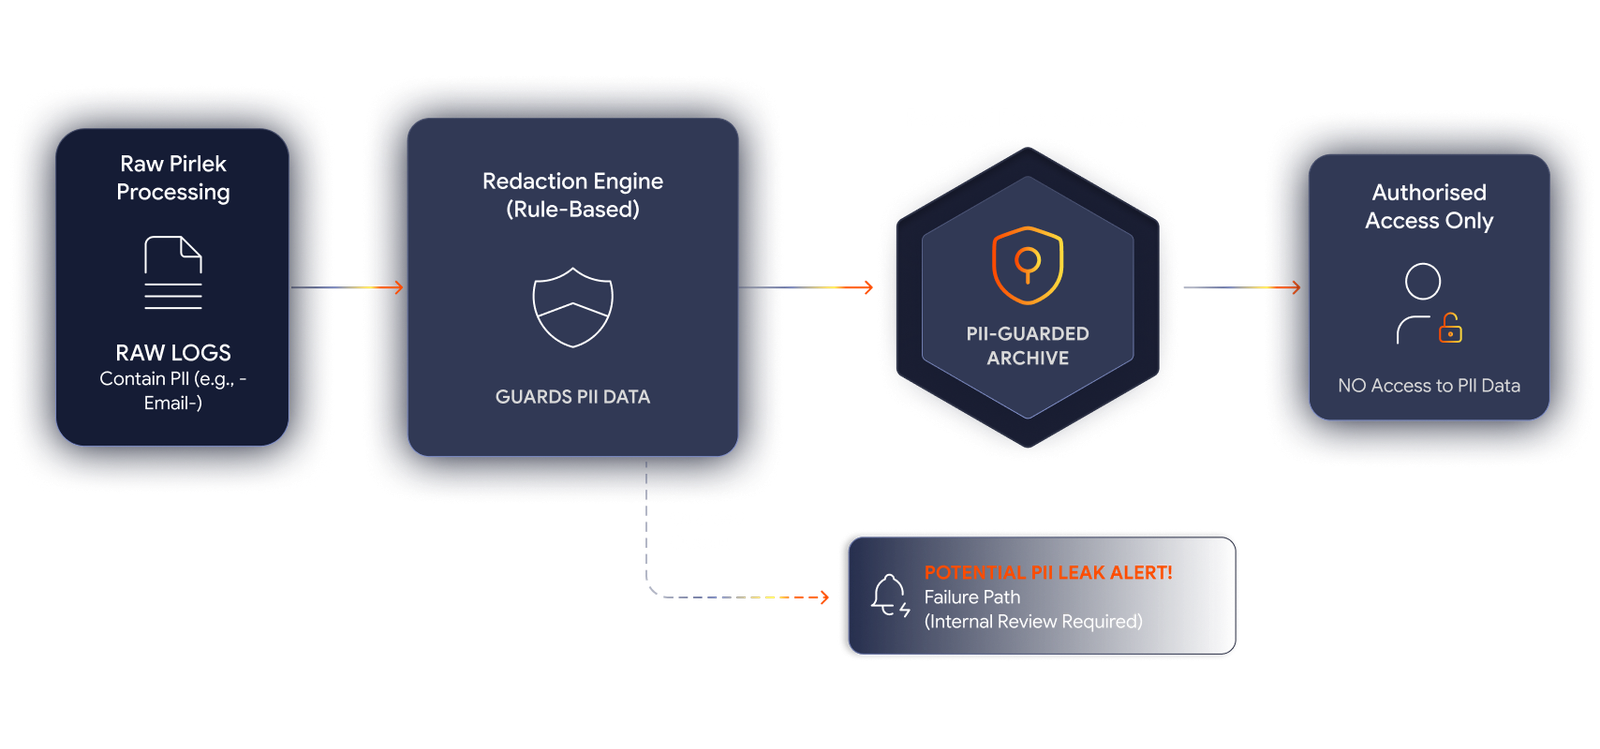
Safe by Default
PII stripped from
logs before storage
Regulation Ready
Supports GDPR, HIPAA,
and SOC 2 handling
No Accidents
Personal data never
sits in a debug log
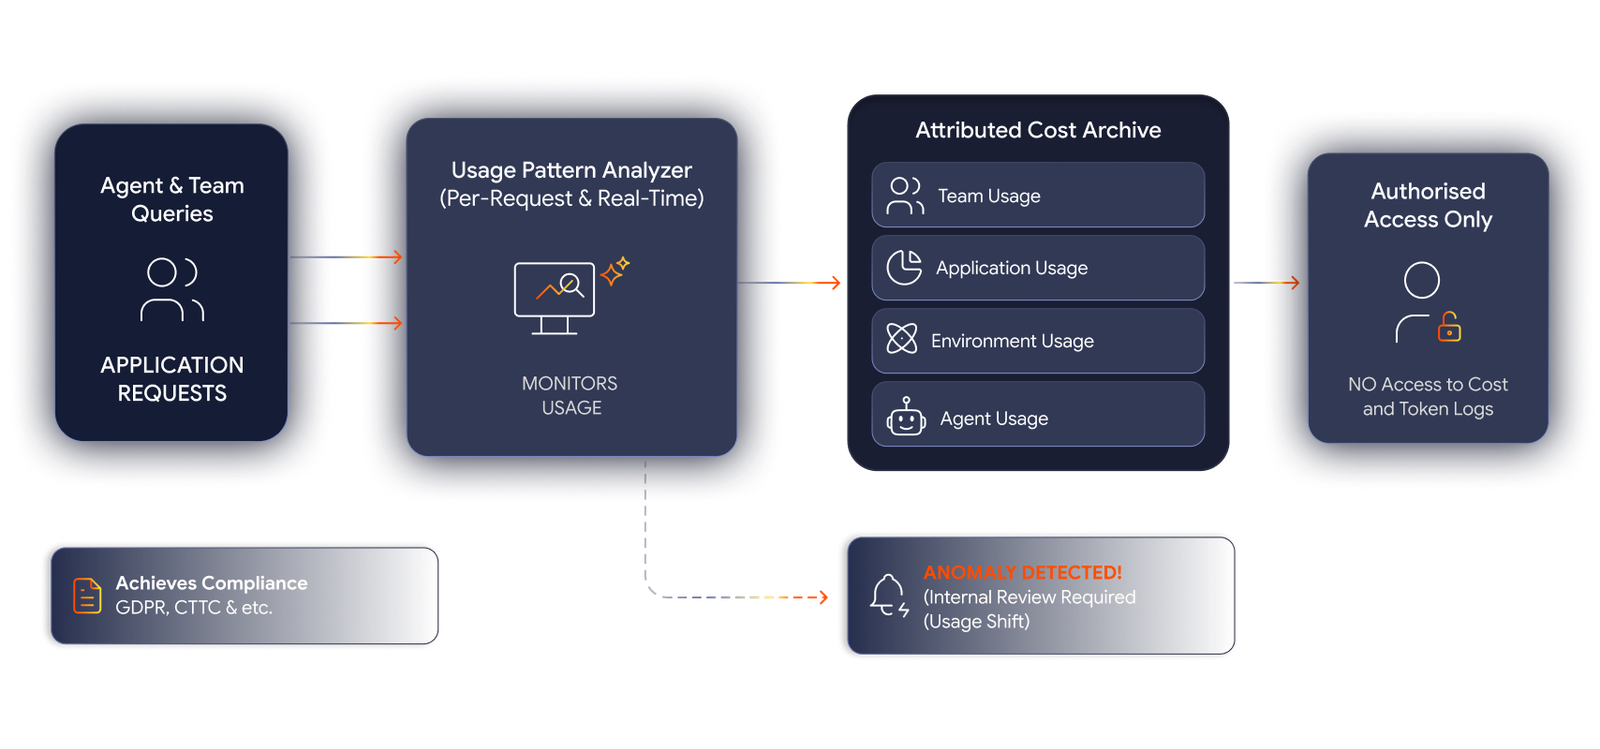
Cost Attribution
Cost tracked by team,
app, or environment
Anomaly Alerts
Usage pattern shifts
flagged immediately
Budget Control
Alerts when spend
nears defined thresholds
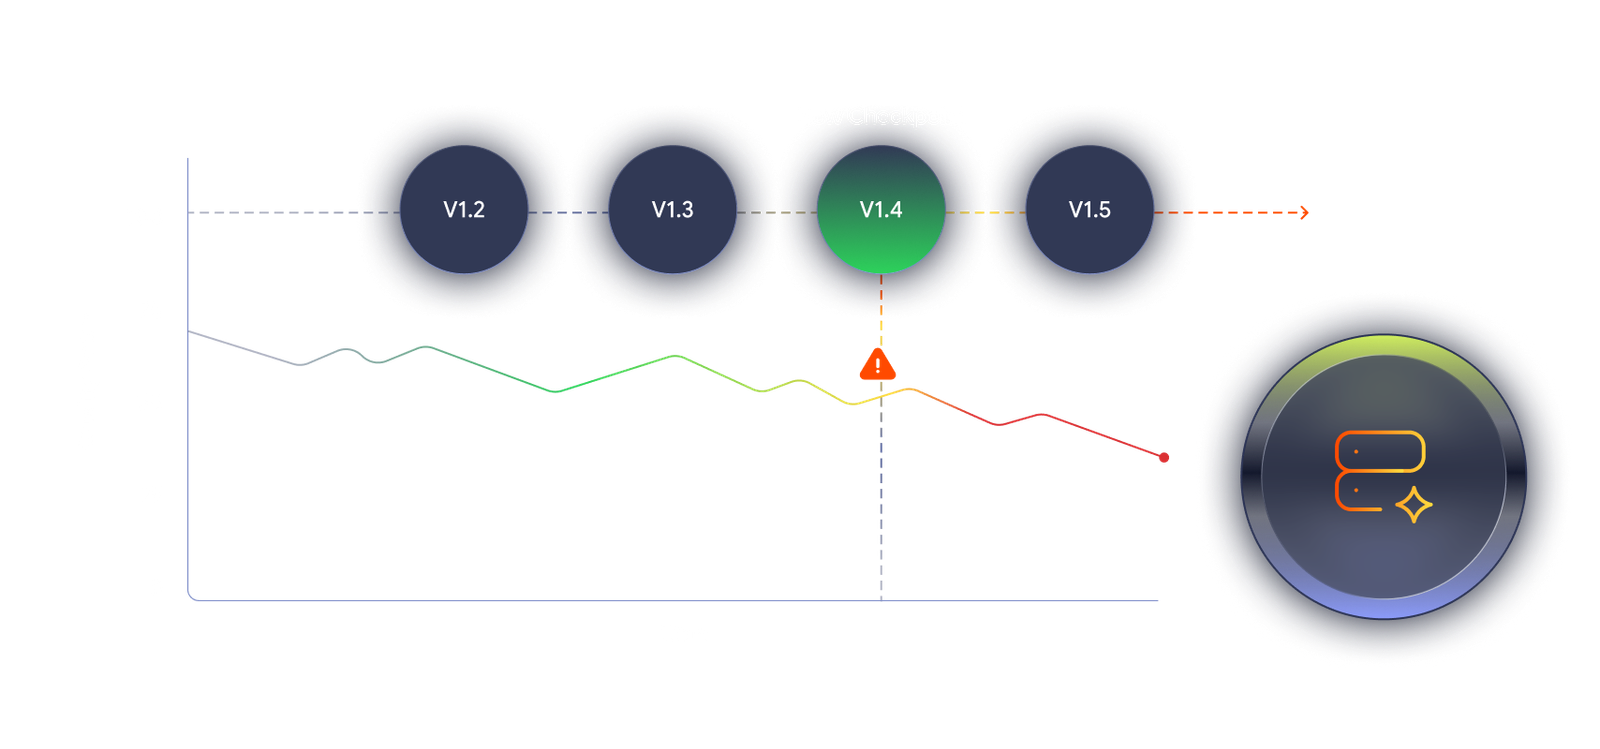
Upstream Warnings
Know when a provider
changes a checkpoint
Silent Drift
Silent upstream
updates surfaced early
No User Surprises
No regressions
discovered via complaints
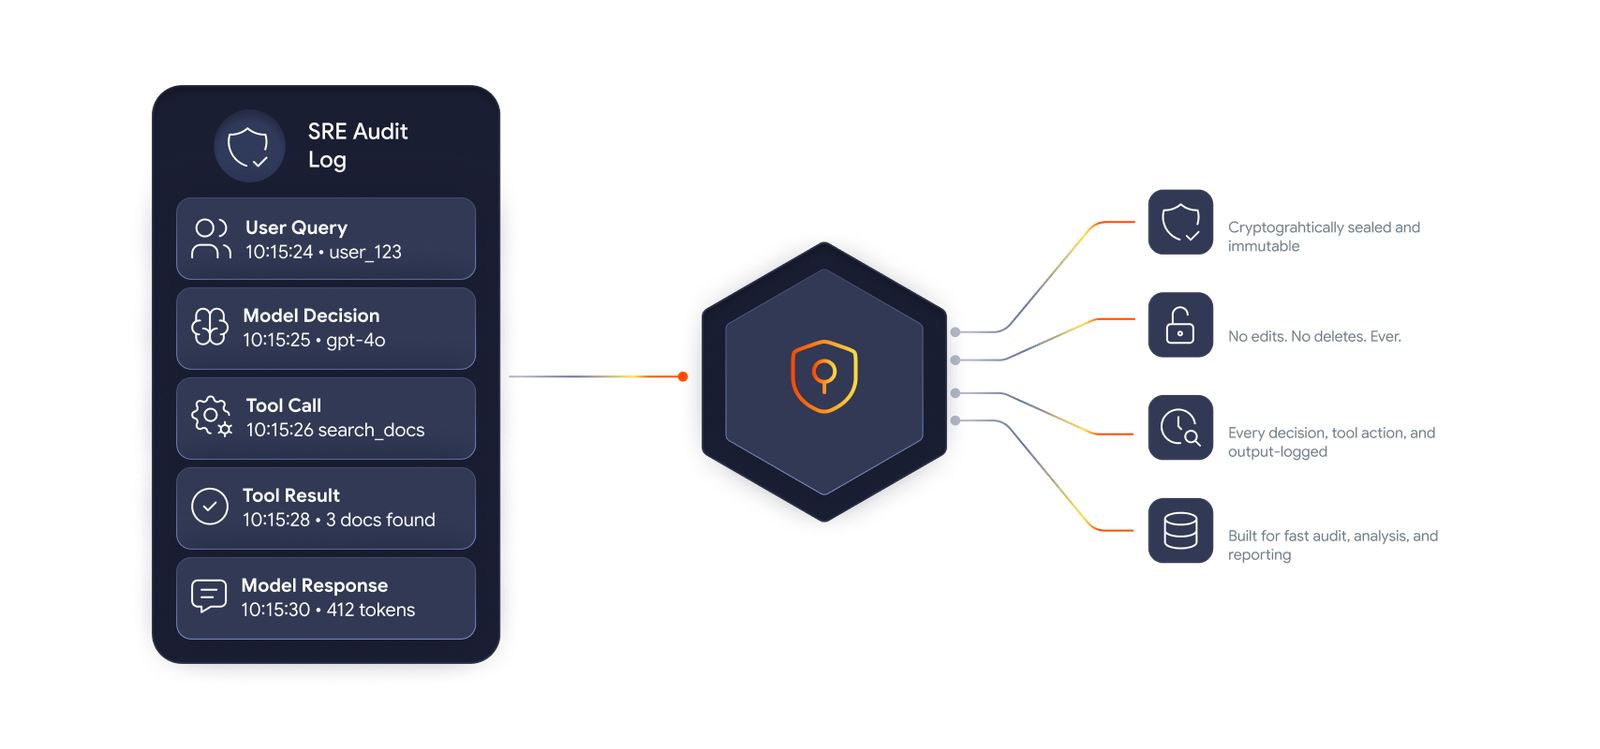
Tamper-Proof Logs
Append-only records
of every model decision
EU AI Act Ready
Meets EU AI Act Article
12 requirements
Audit Confidence
Every tool action
logged for audit
Do You Actually Know What Your AI Did on Its Last Thousand Requests?
TTell us what's running in production, we'll show you exactly what it's doing.
Built for Complexity. Engineered for Scale.
Building the technology capabilities that underpin enterprise scale and resilience.
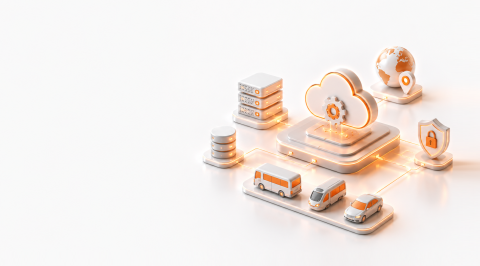
Cloud-native infrastructure modernization for a multi-carrier…
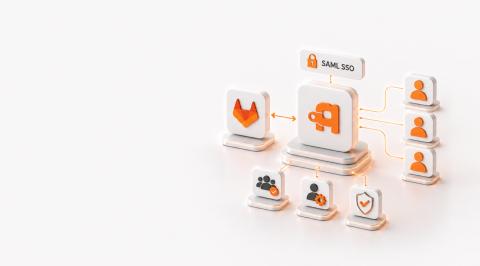
Automated GitLab group provisioning and user access management via…
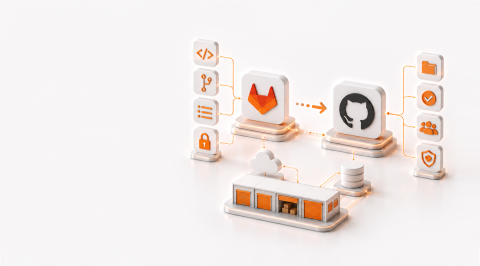
GitLab to GitHub enterprise migration for a self-storage SaaS platform
Automating security alert management with a production-grade Jira…

Production-grade testing for enterprise AI governance
Our Technology Ecosystem












Built for Knowing What Your AI Actually Did
Whether you're in fintech, healthcare, legal, or hi-tech, we give you visibility into exactly what your AI did and why, not just whether the service responded. We work with engineering leads, platform teams, and compliance owners who need proof, not just a status light.
Leaders responsible for AI systems the business can rely on.
Owners who need AI features that genuinely work for real users.
Engineers building and maintaining the technical layer AI systems run on.
Industries that depend on reliable, secure intelligent systems.
FAQs: Questions Worth Asking Before Making a Technology Decision
Strategic guidance to help technology leaders navigate complex technology questions, evaluate approaches, and address what matters most.
AI observability can continuously monitor production outputs for hallucinations, faithfulness, and relevance instead of relying only on infrastructure health metrics. The monitoring layer can sample production outputs against retrieved context and trigger alerts when faithfulness scores fall below defined thresholds, helping teams identify quality degradation before users notice and report it.
Yes. Production AI observability can continuously score outputs for faithfulness, relevance, and hallucination rate. This makes it possible to detect output drift after deployment when prompts change, model providers update checkpoints, or real-world user queries differ from the original evaluation set.
LLM-specific tracing provides end-to-end visibility across an LLM request, including retrieval, model calls, and post-processing. Traces can be captured at the application, session, and span levels, allowing engineering teams to identify the specific stage responsible for a failed request instead of investigating a black box.
RAG observability tracks retrieval recall, precision, and latency alongside vector-store query volume and index performance. This allows teams to determine whether poor retrieval is contributing to weak AI responses instead of looking only at the model layer.
Yes. Multi-agent and tool-call tracing can capture the complete execution graph across agent handoffs, tool calls, sub-agent and skill calls, and retry loops. This gives engineering teams visibility into the exact step where a workflow started failing.
AI observability should begin before production and continue throughout the application lifecycle. Before launch, output quality, safety, and drift can be evaluated against curated test sets. After deployment, every request can be traced across model calls, retrieval, and tool calls, with production data feeding back into evaluation and improvement.
Bring Us the AI Behavior You Can't Explain Yet
We'll trace exactly what happened, and why.
